
Matthew Leitch, educator, consultant, researcher
Real Economics and sustainability
Psychology and science generally
OTHER MATERIALWorking In Uncertainty
Results of an experiment in risk and uncertainty management
by Matthew Leitch, first published 8 October 2004.
Thank you
First, thank you to everyone who participated in this experiment to look at the way words affect our thinking about risk and uncertainty. It took a bit of thought and typing. Fortunately, the results are fairly clear and should make us think about changing, fundamentally, the way ‘risk management’ programmes are designed and communicated, especially if we want to join them up with other management systems, such as performance management.
Summary
For good reasons a debate has been raging among risk management specialists about whether risk management should concern itself with unexpectedly good outcomes and favourable events as well as bad outcomes and unfavourable events. Linked to this has been a debate about what words or phrases to use to communicate this change of scope.
One suggestion has been to talk about ‘uncertainty’ management instead of mentioning ‘risk.’ In theory this should have two beneficial effects: (1) It is open about whether things are negative or positive, and (2) for some people it suggests a more general kind of ignorance than ‘risk’ and should encourage more information gathering. Both effects help encourage people to get their mental blinkers off and see more of the possible futures.
The results of this experiment, based on 36 participants across four alternative wordings, are that asking people for ‘areas of uncertainty’ did indeed lead to a dramatic fall in the proportion of purely negative outcomes considered. There was also a tendency to list more actions that involved finding out more, suggesting a greater interest in reducing ignorance.
The real-life situation to which analysis was applied also affected the types of responses people made, but job role (i.e. whether the respondent was a professional auditor, risk manager, performance manager, or other) made little difference.
An important subsidiary finding is that all subjects who were asked for ‘risk factors’ failed to list risk factors. This suggests that where risk factors are used in an analysis the meaning of the term needs to be carefully explained to stop people from providing sets of risks instead, or risk factors have to be extracted from the conversation by someone who is already able to do so.
Experimental design
The experiment was performed online using the Internal Controls Design website and participants were volunteers who were responding to e-mails posted on various professional discussion lists.
When participants arrived at the experiment page the instructions told them they had to select one of four scenarios and then, for that scenario, think of ‘risks’, ‘sets of risks’, ‘risk factors’, or ‘areas of uncertainty’ in connection with the scenario. The words used in the instructions were chosen at random and participants did not know there were alternative instructions that could have appeared.
The four scenarios were: (1) ‘A building project on your home’, (2) ‘Buying a business’, (3) ‘Looking for a new job’, and (4) ‘Planning a wedding.’ Once the participant had selected a scenario a new screen appeared showing more details of the scenario and repeating the instructions, with more detail.
In addition to listing risks/sets of risks/risk factors/areas of uncertainty, participants were asked to list actions they might take in relation to each item. The instructions were identical in form for each scenario, with just the facts being different in each case.
The responses were categorized in various ways.
Statistical analysis of the results was complicated by the fact that there were three categorical independent variables, two of which were not balanced. The variables were: (1) the words used in the instructions, (2) the scenario chosen, and (3) the job role of the participant.
This analysis was done by assuming that the dependent variable in each case (e.g. proportion of negative items) was simply the sum of three weights, one for each independent variable, and that each possible value for each independent variable had a weight. Excel's Solver was used to find the best fitting set of weights. I also checked for any obvious correlations between the independent variables.
To assess the reliability of the findings in the light of the sample size and variability this analysis was done as each new set of responses was analysed. As more and more results were added to the analysis the results stabilized, though much more so for the weights given to different instructions. This was because of the roughly equal frequency of occurrence. In the subsections below I've shown the graphs used so you can get an idea of the reliability of the findings.
Negative, Open, and Positive statements
Each risk, risk set, risk factor, and area of uncertainty was put into one of three categories:
Negative – i.e. it refers to something purely negative e.g. ‘loss of earnings’
Open – i.e. it is not specifically negative or positive e.g. ‘future earnings’
Positive – i.e. it is something purely positive e.g. ‘rise in earnings’
For each participant, the proportion of items that were Negative was calculated. At first glance it appears that about 6 of the 10 participants asked for ‘areas of uncertainty’ had given predominantly open responses, compared with just 4 of the remaining 26 participants. However, this could have been caused by the scenarios or job roles rather than by the instructions.
To separate out the effect of words, scenario, and job role a simple numerical model was fitted to the actual results using least squares as the fitting criterion. The model used was a simple linear additive model, where each value for each factor was given a number weight and the sum of the weights for a particular participant was compared to the actual proportion of Negative responses.
The final weights were as follows:
| Instructions | Weight | Scenarios | Weight | Job roles | Weight | ||
|---|---|---|---|---|---|---|---|
| risks | 0.439 | Building project | 0.359 | Auditor | 0.289 | ||
| sets of risks | 0.395 | Buying a company | -0.315 | Risk manager | 0.245 | ||
| risk factors | 0.27 | Job hunt | 0.344 | Performance manager | 0.246 | ||
| areas of uncertainty | -0.152 | Wedding | 0.565 | Other | 0.173 |
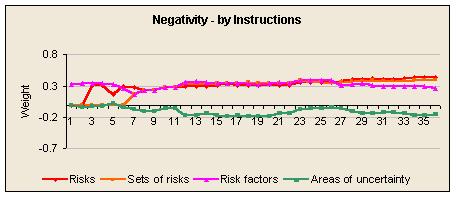
As you can see, there is a powerful effect for instructions. All instructions mentioning the word ‘risk’ were responded to in an overwhelmingly Negative way, but the instructions asking for ‘areas of uncertainty’ provoked more Open responses. (Although not shown above, there were virtually no Positive responses.)
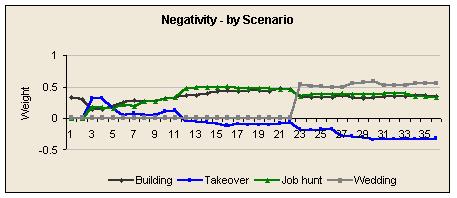
It turns out that the Open responses given by some subjects receiving instructions including the word ‘risk’ were more likely to have been caused by the scenario, Buying a company.
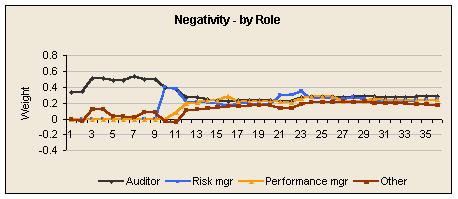
Auditors were inclined to be slightly more negative, though this is a small effect and unreliable.
The following three graphs show how these weights emerged as experimental results were received.
Proportion of items that were of the correct type
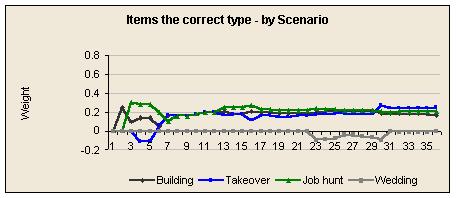
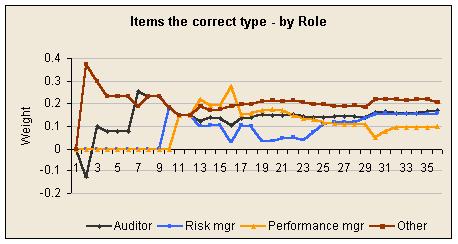
Each risk, risk set, risk factor, and area of uncertainty was classified according to whether it matched the instructions by being the correct type of statement.
An additive model was fitted to the data and the final weights were as follows:
| Instructions | Weight | Scenarios | Weight | Job roles | Weight | ||
|---|---|---|---|---|---|---|---|
| risks | -0.355 | Building project | 0.169 | Auditor | 0.169 | ||
| sets of risks | 0.624 | Buying a company | 0.253 | Risk manager | 0.155 | ||
| risk factors | -0.197 | Job hunt | 0.207 | Performance manager | 0.102 | ||
| areas of uncertainty | 0.558 | Wedding | 0 | Other | 0.204 |
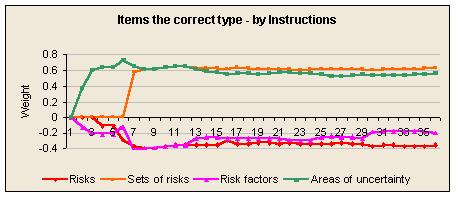
The main observations are the analysis by instructions, because these are the most reliable. Most items were of the correct type when the instructions asked for ‘sets of risks’ or ‘areas of uncertainty’. They were nearly all of the wrong type when the instructions asked for ‘risks’ or ‘risk factors’.
Almost all items that were of the wrong type were because of two errors.
Firstly, if the instructions asked for ‘risks’ people usually gave things that included many possible outcomes, identifiable by the fact that the impact might well be different for an outcome that still matched the description given. By contrast, when the instructions asked for ‘sets of risks’ people were correct in writing items that encompassed many alternative outcomes.
Secondly, if the instructions asked for ‘risk factors’ people almost always gave sets of risks instead. The idea of a risk factor, though useful, seemed to be either missing or completely dominated by the desire to give sets of risks instead.
The following three graphs show how these weights emerged as experimental results were received.
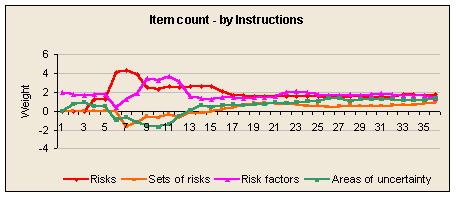
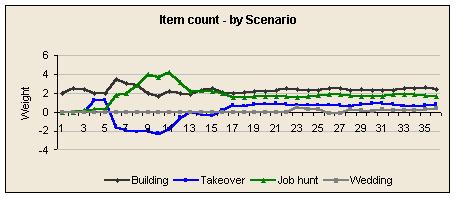
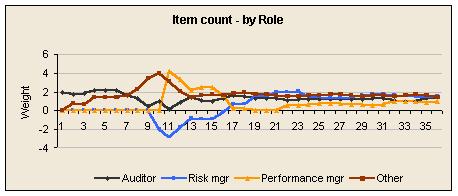
Number of items suggested
The number of risks, sets of risks, risk factors, or areas of uncertainty were counted for each participant and fitted to another additive model to see what factors influenced this number.
The final weights were as follows:
| Instructions | Weight | Scenarios | Weight | Job roles | Weight | ||
|---|---|---|---|---|---|---|---|
| risks | 1.818 | Building project | 2.466 | Auditor | 1.416 | ||
| sets of risks | 0.925 | Buying a company | 0.849 | Risk manager | 1.507 | ||
| risk factors | 1.361 | Job hunt | 1.71 | Performance manager | 1.044 | ||
| areas of uncertainty | 1.325 | Wedding | 0.404 | Other | 1.462 |
People seemed to list more things for the popular scenarios, the building project and job hunt.
There is also an effect due to instructions. Asking for ‘risks’ produced longer lists than asking for ‘sets of risks’ and it may be because ‘risks’ encourages narrower items to be suggested. This may or may not be helpful in risk management depending on the circumstances. Going for narrow risks early on is likely to be counter-productive.
The following three graphs show how these weights emerged as experimental results were received.
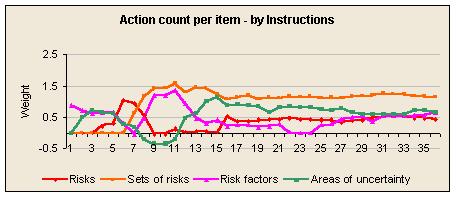
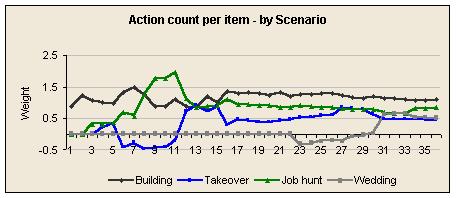
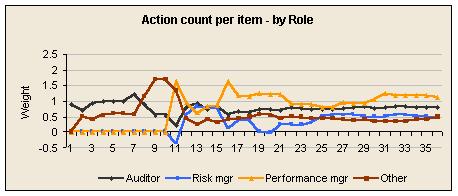
Number of actions per item suggested
The number of actions per risk, set of risks, risk factor, or area of uncertainty was calculated for each participant and fitted to another additive model to see what factors influenced this number.
The final weights were as follows:
| Instructions | Weight | Scenarios | Weight | Job roles | Weight | ||
|---|---|---|---|---|---|---|---|
| risks | 0.434 | Building project | 1.111 | Auditor | 0.797 | ||
| sets of risks | 1.153 | Buying a company | 0.441 | Risk manager | 0.493 | ||
| risk factors | 0.664 | Job hunt | 0.848 | Performance manager | 1.143 | ||
| areas of uncertainty | 0.668 | Wedding | 0.519 | Other | 0.486 |
Once again, people were most prolific in the popular scenarios – building and job hunting.
There is also an effect due to instructions that reversed the item count effect. In other words, the number of actions suggested per respondent was about the same between ‘risks’ and ‘sets of risks’ despite more risks being listed than sets of risks.
The following three graphs show how these weights emerged as experimental results were received.
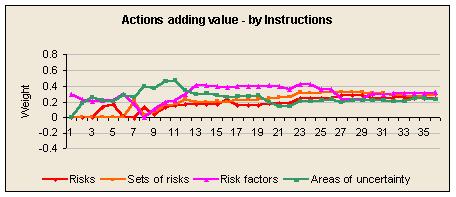
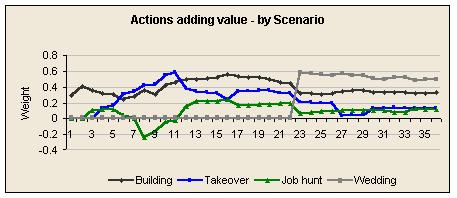
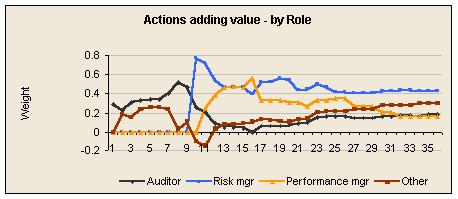
Proportion of value adding actions
Actions suggested were categorised as value adding or not value adding according to a specific rule. The rule was that an action was not value adding if it would still have been needed in a risk free world. The reason for doing this is to explore the extent to which people were prompted to suggest things that responded to their uncertainties.
In real risk management work it is common to get a lot of actions suggested that would have been done anyway, even in a risk free world. People are just filling in the boxes without thinking differently or increasing their awareness of uncertainty.
Obviously this rule gives some counter-intuitive classifications. For example, an action like ‘Make a plan’ is not value adding on this basis, even though making a plan is a very good thing to do. One participant suggested ‘Get drunk’ which I personally don't consider a useful suggestion but classified as ‘value adding’ because it mitigated the impact of an item that was uncertain.
As usual the proportion was fitted to an additive model to see what factors influenced it. The final weights were as follows:
| Instructions | Weight | Scenarios | Weight | Job roles | Weight | ||
|---|---|---|---|---|---|---|---|
| risks | 0.239 | Building project | 0.328 | Auditor | 0.187 | ||
| sets of risks | 0.283 | Buying a company | 0.131 | Risk manager | 0.421 | ||
| risk factors | 0.316 | Job hunt | 0.12 | Performance manager | 0.161 | ||
| areas of uncertainty | 0.233 | Wedding | 0.493 | Other | 0.303 |
Nothing here is of much interest. The apparently high importance of Weddings is the result of having only two participants in who chose this scenario.
The following three graphs show how these weights emerged as experimental results were received.
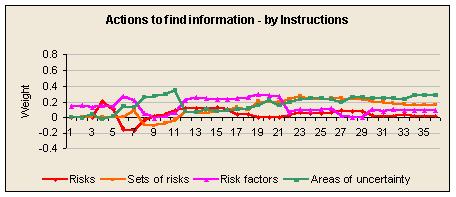
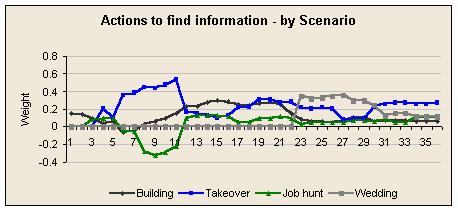
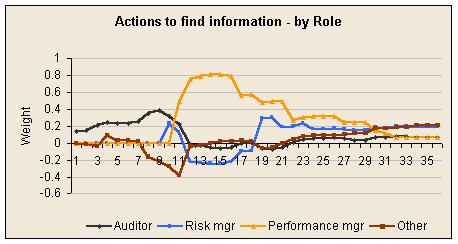
Proportion of actions to find out more
Actions to find more information or think more about information already available are interesting because they are important but can be missed in some risk management work.
As usual the proportion was fitted to an additive model to see what factors influenced it. The final weights were as follows:
| Instructions | Weight | Scenarios | Weight | Job roles | Weight | ||
|---|---|---|---|---|---|---|---|
| risks | 0.015 | Building project | 0.058 | Auditor | 0.075 | ||
| sets of risks | 0.157 | Buying a company | 0.269 | Risk manager | 0.185 | ||
| risk factors | 0.093 | Job hunt | 0.102 | Performance manager | 0.073 | ||
| areas of uncertainty | 0.28 | Wedding | 0.115 | Other | 0.212 |
Actions to find out more were particularly common with the ‘areas of uncertainty’ instructions and in the ‘Buying a company’ scenario. In other words, they tend to go with Open items.
The following three graphs show how these weights emerged as experimental results were received.
Choice of scenarios
Participants had a free choice between the four scenarios and there was a clear preference for the building project and against planning a wedding! The number of participants selecting each scenario was as follows:
| Scenario | Participants |
|---|---|
| Building project | 19 |
| Buying a company | 5 |
| Job hunt | 10 |
| Planning a wedding | 2 |
Comments by respondents
The survey asked if the respondent had any other comments they would like to make about the survey or about what they had been asked to do. Excluding comments purely about the survey, the respondent comments were:
‘It's helpful with a task to outline the risks and the response. Would also be helpful to do the benefits. There may also be advantage to having input from others on these tasks, which a survey like this does not give.’
‘This is top of mind stuff, but interesting to do.Ā One could probably provide a more detailed / longer response with more time.Ā You may have noticed that we have recently renovated our house – and ran way over budget!’
‘I have been in this situation before, and the ideas above reflect an approach to ‘risk management’ I have found successful.’
‘I'd spend more than 5 minutes on planning a major extension usually.’
‘I quickly lost interest as the answers are so likely to end up as a text-book case for a new business acquisition. I didn't see what the exercise was likely to achieve – the subject is already well documented. Sorry – but this is my honest answer.’
‘Could go on for ever – it depends how closely related the risks are to the problem, and a lot of risks are to do with extraneous circumstances coinciding with the project (war, weather, acts of god...).’
‘An interesting exercise – I could list many more, but these seem to be the key ones for me.’
‘The ‘bottom line’ is not strictly financial but relates to satisfaction with the resulting living space or environment.’
Respondent profile
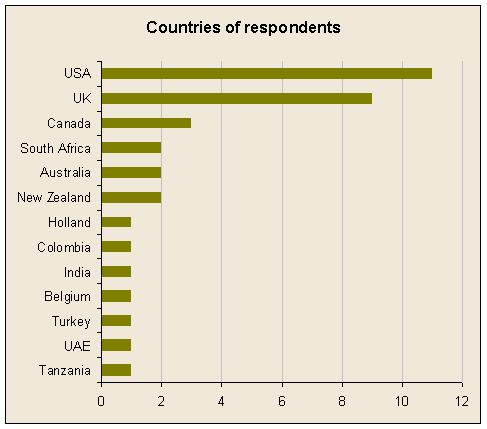
Respondents were invited to participate using professional discussion lists on the Internet and by some personal e-mails, but only where I was confident the person would not be predisposed to answer in a particular way. For example, if someone wrote to me about how they were interested in evolutionary project management I would not invite them to participate.
Most respondents were from the USA and UK. The countries of respondents are shown on this graph:
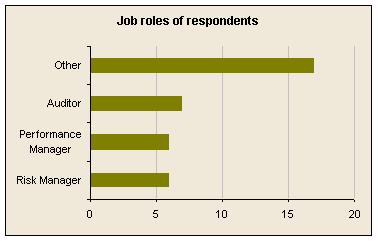
The roles of respondents are shown on this graphic:
Limitations of the survey
The main limitation on this study is the unbalanced experimental design and the complications of three categorical independent variables. This makes the statistical approach unusual and the interpretation of results more difficult. Results for scenarios and job roles were usually unreliable because some scenarios and some roles were chosen rarely.
Further information
Most of the practical thinking behind this study is explained in ‘How to run a Risk Listing meeting’, which appears on www.workinginuncertainty.co.uk.
If you would like to analyse the original data yourself I can provide a matrix of the raw data. The information will not allow you to identify respondents or their organisations.
Copies of the original survey are also available. Please contact me at matthew@workinginuncertainty.co.uk.
Words © 2004 Matthew Leitch. First published 8 October 2004.