
Matthew Leitch, educator, consultant, researcher
Real Economics and sustainability
Psychology and science generally
OTHER MATERIALWorking In Uncertainty
Results of a survey on pay and sustainability
First published 19 May 2004.
Contents |
Thank you
First, many thanks to everyone who responded to this survey. The results are fascinating and the large numbers indicate that further, properly funded research is justified and its results could have huge implications.
Summary
I recently visited a large office in London with a shop selling snacks. The tiny room with the shop was almost unbearably noisy and hot thanks to the refrigerated cabinets and there was no window. A woman sat alone at the till to take my money. I thought ‘What a terrible place for her to work.’
The survey set out to find out how much we care about our working conditions, and to link those conditions to sustainability. Respondents were asked to give information about their current job and pay, then asked to imagine that their job was different in various ways. Some of the changes improved conditions while others made them worse relative to their current job. Respondents stated how much more or less their pay would have to be to leave them as happy as they are now while working under different conditions.
If the respondents can be believed their employers can save around 10 - 15% of total payroll costs by turning their organisations into sustainable organisations (i.e. organisations with no unfavourable environmental impacts).
That's a lot of money. For example, the American Petroleum Institute estimated that meeting Kyoto Protocol on carbon emissions would cost the USA $300bn annually. A huge sum and hotly disputed, but less than a third of the money this new survey now indicates could be saved from payroll costs.
The pay changes needed to compensate people for working under worse conditions than they do currently were much larger, according to respondents. This is something for organisations to bear in mind when they, for example, centralise their offices. The initial financial impact may be a measurable saving, but the long term impact could well be a stealthy but larger increase in costs.
To allow the results of the survey to be generalised more safely it also looked at the impact of each individual change, the difference in attitude between people personally committed to action on sustainable development and others, and the effect of initial pay level on the amount of money people are prepared to forego in exchange for better, more sustainable working conditions.
The survey was carried out during March, April, and May 2004 using a website and by inviting members of various professional discussion lists to respond. In total 40 people responded, giving stable numbers for the main results.
Respondents
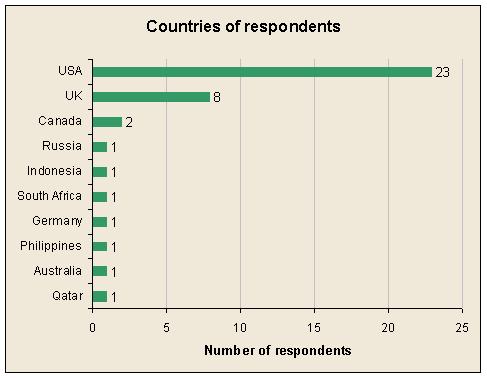
There were 40 respondents, who visited the survey website in response to publicity on various professional internet discussion lists or, occasionally, in response to direct emails from me. Most responses were received during March and April 2004. Responses were mostly from the USA, but several other countries were represented.
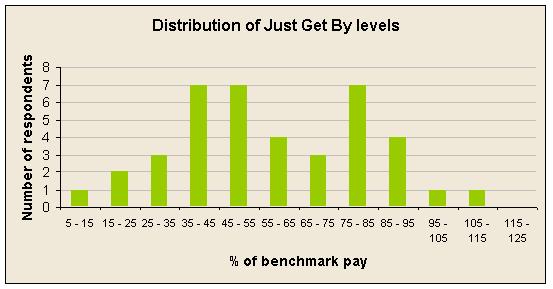
Respondents' pay levels varied greatly. Absolute pay was not collected during this study, but respondents were asked to say what level of pay would be just enough for them to get by, expressed as a percentage of their benchmark pay. The distribution of ‘just get by’ pay levels looked like this:
Choice of benchmark job
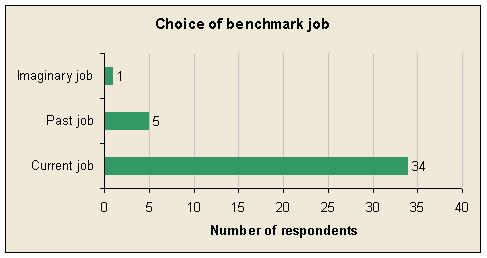
Respondents were asked to choose a ‘benchark job’ to use throughout the survey. (They then imagined changes to that benchmark job and its pay.) Respondents could choose their current job if they had one, otherwise a past job, and finally, if they had never had a job, they could choose an imaginary job.
In fact nearly all the respondents chose their current job, as this graphs shows:
Size of the overall effects
The overall size of the effects in this study depend on how you measure them. The simplest measure of overall effect is the average pay level for the ‘all good things combined’ condition and the ‘all bad things combined’ condition. Measured this way the combined effect of all favourable changes to working conditions was a drop in pay of 16.55% of benchmark pay, and a combined effect of all unfavourable changes of an increase in pay of 131.25% of benchmark pay.
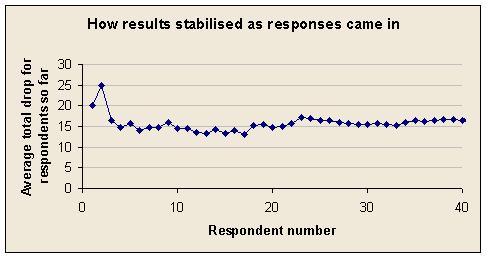
The most important to measure accurately is probably the effect of improved working conditions. The standard deviation of these ratings was 12.77, giving quite a large confidence interval. Another way to get a feel for the accuracy available from 40 respondents is to look at how the combined effect stabilised as responses came in, becoming fairly settled beyond about 25 respondents.
However, it is possible to produce slightly more reliable estimates because the combined-effect ratings are related to the ratings of individual factors, and these are much more numerous. By working out the relationship between individual ratings and combined ratings it was possible to produce alternative estimates of the combined effect that are slightly more reliable.
The value we put on money is proportional to the logarithm of how much money we have. Your millionth pound or dollar is less valuable to you than your last. To link the individual factor ratings to the combined ratings requires plotting the logarithm of the combined rating against the logarithm of the product of the individual factor ratings. This produced quite a clear pattern and the graph shows a straight line fitted to it.
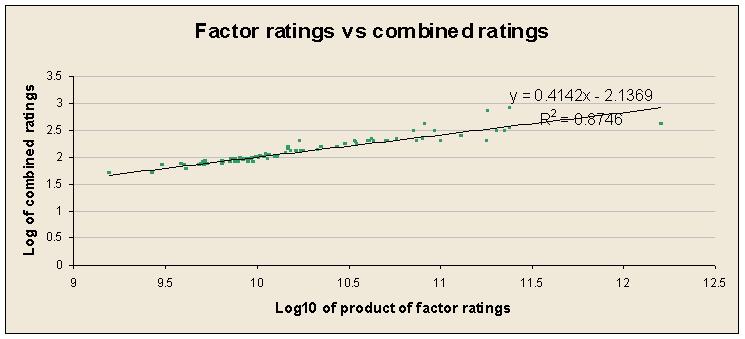
Using the equation shown on the graph, which links individual factor ratings to the combined rating, allows alternative estimates of the combined effect of working condition changes. The combined effect of favourable changes is a pay drop of 11.95% and the combined effect of unfavourable changes is a rise in pay of 119.24%. These are slightly less than before.
The equation could be used to estimate the impact of changing only some aspects of working conditions.
Impact of each aspect of sustainability
Respondents were asked to consider changes to their job related to five factors, and to make an overall judgement. The five factors were: workstation conditions, attitude of employer to sustainability, travel requirements of the job, job security, and beauty of work environment.
For each aspect they were presented with a bad change, then a good change. Finally, they were asked for the combined impact of all the changes they had considered bad, and then the combined impact of all the changes they had considered good.
Here are the items presented to subjects, with percentage change to benchmark pay (i.e. usually current pay) that would leave the respondent as happy. Negative percentages represent reductions in pay relative to their benchmark.
| Item description and instructions | % pay change |
|---|---|
| Your workstation has no natural light or fresh air. You hear the constant hum of air conditioning equipment, and whine of old VDUs or other equipment. There is no variation in room temperature, no plant life of any kind. The air is legal, but slightly stuffy with the scent of glues and other chemicals from the carpets, computers, or other machines. | 37.2 |
| You have loads of natural light and fresh air, but fairly even, comfortable temperature thanks to windows you can open, blinds you can adjust, natural ventilation, and superb insulation. There is plenty of greenery, and clean, fresh air. | -5.6 |
| Your organisation's activities are not sustainable. On the contrary they are polluting and heavily dependent on non-renewable resources. Your employer argues against environmental regulations. | 74.2 |
| Your organisation's activities are almost completely sustainable. They are non-polluting and use only clean renewables. Its achievements are widely known, respected, and often written about. A shining example. | -9.1 |
| Your journey to work is a car drive more than an hour long, each way, mostly spent in traffic jams. As part of your job you travel extensively, often staying away from home because your 'customers' are widely spread and your organisation's premises are centralised in one place. | 48.7 |
| Your journey to work is a walk of 15 minutes or less along quiet, leafy roads. You travel rarely as part of your job because your organisation is not centralised. | -9.6 |
| Your employer is obsessed with growth. In good times it hires and invests aggressively, but when there's a downturn it cuts back even more aggressively. Hire 'em, fire 'em. | 48.7 |
| Your employer aims for longevity and secure jobs. In good times it raises prices (assuming it is a business) and salaries. In bad times it reduces prices and salaries. Redundancies are a last resort. | -2.8 |
| Everything around you at work is crudely functional. It works, but it's ugly. When the time comes for this lot to be thrown out you'll be happy. | 19.1 |
| Everything around you is designed carefully for function, flexibility, longevity, and beauty. This stuff will look good decades from now. Too good to throw out. | -5.9 |
| Now imagine your benchmark job changed to include all the worst from the scenarios above - surroundings, travel, job security, impact on society. That's all the bad changes combined. How much difference in total does it make to you? | 131.3 |
| Finally, imagine your benchmark job changed to include all the best from the scenarios above - surroundings, travel, job security, impact on society. That's all the good changes combined. How much difference in total does it make to you? | -16.6 |
The following graph summarises the above results. The black bar represents the level of pay (as a percentage of benchamrk pay) that the respondent could ‘just get by’ on. The green bar is the drop in pay that would be acceptable if working conditions changed favourably. The orange bar is the rise in pay that would be needed to compensate for worse conditions.
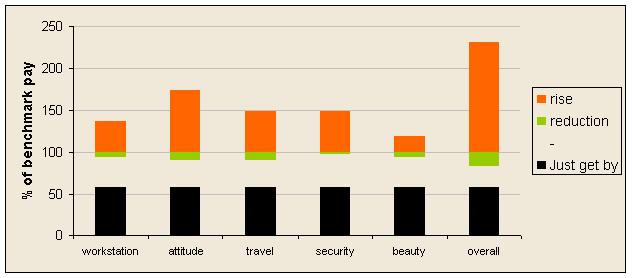
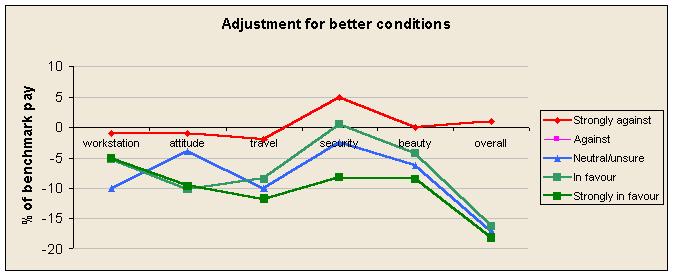
As you can see most respondents considered the attitude of their employer towards sustainability to be very important. (The link between responses and personal attitude towards action on sustainability is explored in a later section.) Travel requirements were another strong factor.
The item about job security tended to split respondents. While most thought that increased job security was attractive, 7 out of the 40 thought it unattractive. This may be related to how confident people are of getting a job elsewhere if their current employer runs into trouble. People who have gained from growth but avoided downsizing may prefer companies to expand and contract their operations sharply. People who have been made redundant (perhaps more than once) as a result of their employer's aggressive growth plans and could not recover easily may find security more attractive.
Commitment to action on sustainability
In an online survey about sustainability where respondents are volunteers one would expect that most respondents would have a leaning towards ‘green’ views and this might influence their responses. The results do show a link between views on action on sustainability and values on working conditions. However, it is not possible to say whether the link is causal or, if so, which direction it is. Perhaps people who value the personal impact of sustainability are also inclined to favour action on sustainability. Alternatively, perhaps people in favour of action wanted to send a message through this survey and gave high values accordingly.
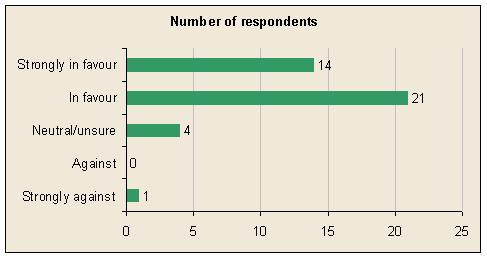
Respondents were asked for their attitude towards the actions usually promoted as favouring sustainability. The number of respondents giving each answer is shown in this graph. As expected, most were in favour to some degree, though one person was strongly against.
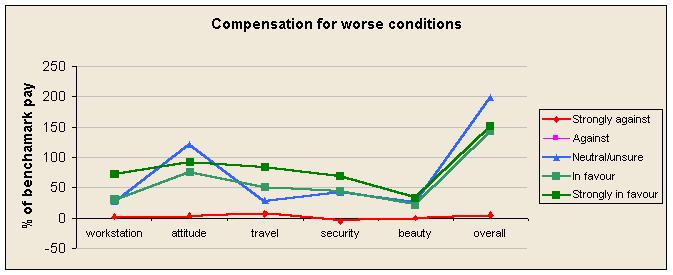
The average results for each of these respondent groups are shown in the next two graphs. One graph shows increased pay needed to compensate for worsened conditions, while the other shows the reduction acceptable if conditions improved.
Initial pay level
As the survey was carried out on the internet and publicised using a variety of professional discussion lists it was inevitable that most respondents would be reasonably well paid, professional people, perhaps better educated than average.
It is obvious that a person on the breadline will be less inclined to trade pay for improved working conditions than someone who is paid far more than they need. On the other hand many on low pay also suffer poor working conditions. Another possibility is that some of the better paid respondents are better paid precisely because they are very focused on money and getting more for themselves.
The links between pay in the benchmark job and variations of pay with working conditions are complex in principle and empirically. As expected very few respondents were prepared to go below their ‘just get by’ level of pay in search of better working conditions. Two exceptions to this were two individuals who rated their benchmark job as being at or below their ‘just get by’ pay level. They explained that this was because they relied on their partner's income. (This was not the intention of the study but that was not made clear to respondents.)
In this graph the red line represents the threshold beyond which respondents are saying they are prepared to work for less than their ‘just get by’ level. The slanting black line is the best fitting straight line and confirms that the closer a person's ‘just get by’ pay level was to their benchmark pay level, the less the percentage of pay they would trade for better conditions. However, note that the data points are very spread showing that this is a weak relationship. (Excluding the two data points to the right of the red line does not change the best fitting line noticeably.)
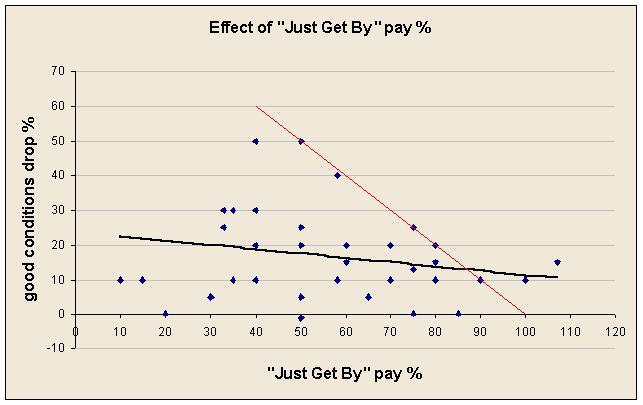
Respondents with low disposable income were prepared to trade a higher proportion of it for better conditions, but this was lower as a percentage of their ‘just get by’ pay than the wealthier respondents would trade.