
Matthew Leitch, educator, consultant, researcher
Real Economics and sustainability
Psychology and science generally
OTHER MATERIALWorking In Uncertainty
A way of thinking about probability
First published 7 June 2005.
Introduction
Probability. I used to think I understood the idea. Then I discovered I didn't. Now it's making sense again, but not the way it used to.
If you know a bit about probability but have never really considered deeply what it actually means then you should find this article contains some surprising revelations; revelations with practical implications too, not just philosophy.
Time to lift the lid on probability
I'm about to toss a coin. What is the probability that the result will be "heads"? Every schoolboy and girl knows the answer is 0.5, but this is a trick question and cannot be answered with just ‘0.5’.
Who said the coin was fair? Who even said the coin had a ‘heads’ side at all? The coin on my desk was presented to me by the United States Army and does not have a head on it. Who said the coin would land on a hard, flat surface so that there would be one side up?
In school textbooks the coin is assumed to have ‘heads’ on one side only and to be fair which, by definition, means that if tossed many, many times the proportion of heads would be about 50%.
In real life, situations don't repeat exactly. Any past condition might be relevant and we would have to reconstruct the entire history of the universe to completely reproduce a situation.
In real life it is not so obvious what aspects of a situation we would have to repeat to measure the relative frequency of different outcomes.
Let's take a situation where school textbook assumptions do not hold. Imagine you are a doctor trying to decide if you should prescribe a new and expensive drug to a patient who definitely has a particular illness. The drug has been used 1,000 times before and in those cases 500 patients died while the rest recovered. If nothing is done the patient will certainly die.
What is the probability of death if you give the drug? Is it 0.5 (i.e. 500 out of 1,000)? The patient is male. Of the 1,000 patients previously given the drug 500 were male and of these only 200 survived. Is the probability of death then 0.6? Setting other factors aside for a moment, the patient is Caucasian. Of the 1,000 previous patients 600 were Caucasian and 350 survived, so is the probability 0.58 (i.e. 350/600) for that reason?
You also notice that the patient is diabetic. No diabetic person has been given the drug before, but surely this patient's chances are lower somehow because of his diabetes?
And what if there was some genetic factor, or combination of several different factors, that perfectly predicted survival or death? What would be the relevance of probabilities then?
Probabilities can be hard to think about. How are we to make sense of this? What is the most advantageous strategy?
A perspective
Clearly, probabilities are not just properties of the individual situation in which we must make a prediction. They are numbers generated by prediction rules we use and the values a prediction rule should produce to be accurate are a property of the set of situations to which the rule is applied.
Let's define some terms.
This way of thinking about probability rests on defining sets of situations. For example, tosses of a particular coin, or candidates sitting an examination. A set of situations is defined by some kind of rule that gives criteria for whether a situation is included in the set or not, and that identifies the events that may occur in that situation. For example, Head or Tails, Pass or Fail.
Statisticians often talk about ‘populations’ and the idea is similar. However, ‘population’ suggests a group of existing things, whereas ‘situations’ concentrates more on future occurrences. One might have a population of penguins on a beach, and the set of situations could be catching penguins. Different ways of catching the birds might lead to different outcomes when you measure, for example, their weight.
Situations are put into sets on the basis of certain of their attributes and so have commonalities. Of course situations have many attributes and usually only a few are mentioned in the criteria for being in a set. The other attributes are background conditions. They influence outcomes too.
As situations in a set of situations unfold various outcomes may result (one outcome per situation). To systematically analyse outcomes we need to group them into sets called events.
The most appropriate grouping is sometimes obvious, as with coin tosses resulting in Heads or Tails. Usually there is some thinking to do.
A prediction rule is a rule that, for a given situation, assigns probabilities to possible future outcomes of that situation. A prediction rule only applies to certain situations, and that set must be defined to have a meaningful prediction rule.
A set of applicable situations is defined for a prediction rule and this will also identify the outcomes in those situations. Different prediction rules may use different techniques for specifying the set of applicable situations.
A learning strategy is a technique for creating a prediction rule or set of prediction rules, and for improving it/them in the light of experience.
Example 1: A very simple prediction rule for coin tossing might just say ‘Heads 0.5, Tails 0.5, applicable whenever a coin is tossed.’ This might have no learning strategy to go with it because you don't expect to be wrong.
Example 2: Alternatively, your prediction rule for coin tossing might be quite a lot more complicated and involve a prior distribution for the ratio of Heads that is altered by computing the impact of actual experience with the coin in question so far. It might restrict its application to only tosses of coins with a Heads side, and only on earth, spun vigorously by a human hand, etc. The learning strategy will be to add new experiences with the coin to the dataset used and recompute the distributions.
Why probability thinking works at all
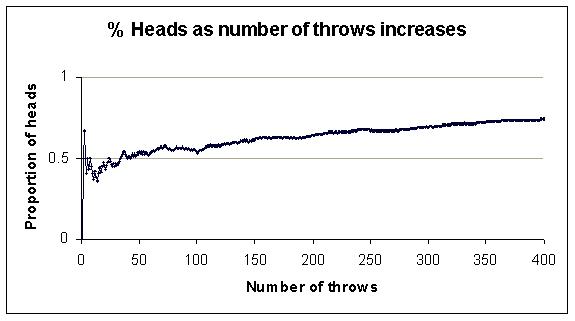
The past is a guide to the future, or probabilities wouldn't work at all. Situations that are the same to the extent that they meet some criteria we specify don't always lead to the same outcome, but if we observe lots of those situations then very often the relative frequency of different outcomes converges to stable numbers.
Here is the classic example. Toss a fair coin and record the proportion of tosses so far that resulted in Heads. Gradually the proportion gets closer to 0.5, though not always as quickly as in the graph below. Notice also that sometimes the proportion gets further away from the eventual frequency before heading back in the right direction.
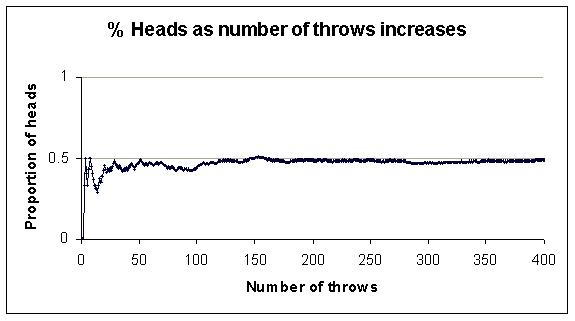
If, for example, the frequency of Heads from a vast number of coin tosses has been 0.5 then given another example of that situation for which the outcome is not yet known we might say the probability of Heads is 0.5.
In that example there were only two events for the situation, Head and Tails. Usually there are more and often there are, theoretically, infinitely many events. For example, if we were catching alien creatures on a planet and weighing them then every different weight might be an event for the situation, ‘catch another alien and weigh it’. Suppose we plotted their weights and the first 200 looked like this:
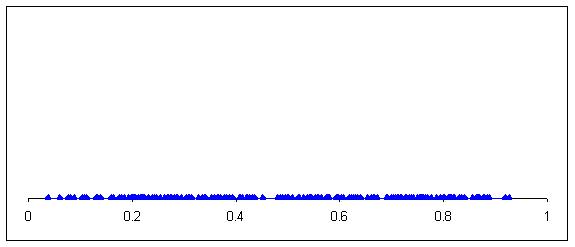
It's easier to see how the weights are distributed if we group the weights and make a bar chart.
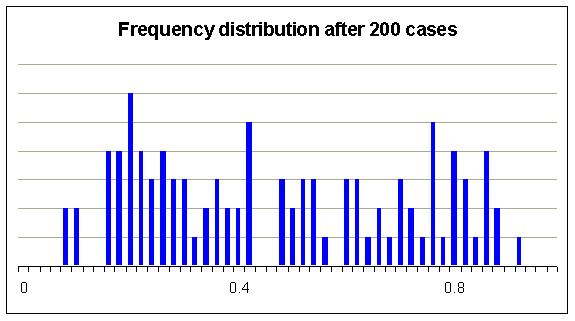
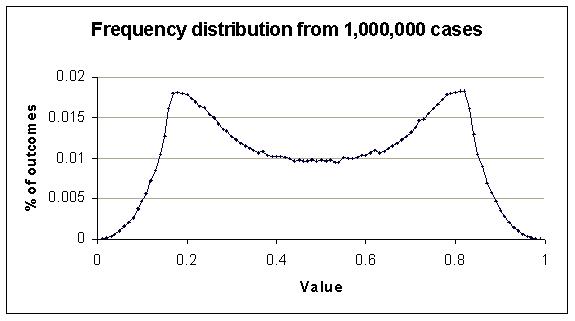
Can you see any kind of pattern yet? As with coin tossing the proportions of different events from situations in a set of situations tend to stabilise. After an exhausting session of catching aliens and weighing them we might get a clearer picture.
It is this stability of frequencies that makes probabilities useful. It is also what makes it possible to talk about the accuracy of a probability. A probability is something that can be tested against reality, if we have some examples of situations that are within the set of situations that a prediction rule applies to.
However, there are some limitations with this:
We can never get enough repetitions to know exactly the ‘true’ figures for relative frequencies. To know exactly we would need an infinite number of repetitions. In practice there are situations where we are lucky to get any at all.
We must be careful how we sample. If we study repetitions of a situation that are sampled in some systematically selective way this can produce relative frequencies that are misleading because they bias background conditions. For example, suppose we are studying the effectiveness of a new drug on humans generally but all the patients in our study are from one country. Obviously there could be background conditions for these patients that are not representative of humans generally and that distort the picture. We need to change our prediction rule in some way, or the situations to which it applies, make some adjustments when using the data, or sample patients differently.
This is particularly a problem where we manufacture a situation rather than discover it.
Relative frequencies may change over time. What is the probability that a person born in the UK will suffer from asthma at some point in their life? It depends when that person is born, because incidence of asthma has been increasing over recent decades for reasons that are not well understood. The graph below shows coin tossing where the coin is progressively biased over time. The frequency of Heads does not stabilise in the usual way.
Not every situation, if repeated, has convergent relative frequencies. For example, if you play chess against someone repeatedly the relative frequencies of their strategic choices may never converge. It is more than just a gradual change over time; they are intelligently reacting to you.
Uncertainty about relative frequencies
Given a definition that identifies a certain type of situation as being relevant, and the way outcomes are classified in those situations, we can in theory find the relative frequency of those classes of outcomes, if they do converge to stable numbers and if we can study infinitely many examples of those situations.
In practice we sometimes can't be sure the numbers will converge and we certainly can't study infinitely many examples. So we are always uncertain about what the true relative frequencies really are.
Usually we assume the frequencies will converge, so the numbers we call ‘probabilities’ represent the combination of two things: (1) the true long term relative frequencies of outcomes in specified situations, and (2) our uncertainty about what those probabilities are.
It is misleading to ignore either component and often helpful to explicitly separate them in making prediction rules.
For example, if the task is to give the probability of heads for tossing a given coin a crude prediction rule might be ‘Heads : probability 0.5.’ But, how to revise this if repeated tosses suggest that there is a heavy bias to the coin or the tossing method?
A more sophisticated method is to have a probability distribution for the relative frequency of heads. The probability distribution represents our uncertainty about the true relative frequency of heads under repetitions of the situation specified. The prediction rule will produce probabilities for heads by combining the relative frequencies with the probability distribution. The learning strategy will add the results of tosses to the data driving the probability distribution, applying Bayes' rule perhaps.
Using relevant experience
We have a wide range of prediction rules and learning strategies to draw on so it is hard (and perhaps even impossible) to find a situation where we have nothing applicable, though we may need to rely on judgement rather than explicit calculations.
The simplest prediction rules try to match situations with past situations for which the results are known. Where we have a lot of recorded experience and can find what seem to be close matches the past proportion becomes our probability, or at least the data that modifies prior beliefs. With this strategy there is a lot of scope for improving rules by dividing past experience into clusters that give strong predictions, while avoiding such small clusters that the experience in each one is limited. More sophisticated rules take more account of differences between situations, perhaps calculating past proportions with a weighting that gives more credence to more similar situations. Still more sophisticated rules try to find systematic relationships between variations in aspects of the situations and the outcomes produced. This can produce the ability to interpolate and even extrapolate to generate accurate expectations for situations not previously encountered.
In addition, simple probabilities for elementary events can be combined into models that predict probabilities for more complex interactions of events.
Where do uncertainty distributions come from?
This leads to another difficult question: What is the right basis for choosing uncertainty distributions?
Are they subjective views with no link to relative frequencies? Or, are they in fact relative frequencies from some other, more widely applicable, prediction rule?
For example, if the task is to create a prediction rule for tosses of a certain coin, and the learning strategy uses a prior distribution of the proportion of heads, then that prior distribution could perhaps be prediction from a rule that is applicable to ‘coin tossing generally’ or ‘gambling devices given to me by shady characters.’
Where would this end? Can our gut feelings be traced back to prediction rules that have been created by the trial and error methods of evolution?
A surprising observation
You could apply more than one prediction rule to a given situation and come up with more than one probability, even though all the probabilities are accurate.
Sound weird? How could different probabilities for the same situation all be right?
Consider this. How could you tell if a probability assigned by a prediction rule was right or wrong? You would have to look at the results of applying the rule many times and see if it seemed well ‘calibrated.’ This means that, for example, if you look at all the outcomes where the prediction rule said 0.7 about 70% of them should have come out to that outcome.
Two prediction rules might apply to two different sets of situations, but with an overlap. Where there is an overlap their predicted probabilities could be quite different but the rules could still be well calibrated over their entire set of applicable situations.
Which probability should we use? It depends on how you are using the prediction rules to drive policies for action. One approach is not to use either probability, but instead to define the overlap in situations as a new set of situations and start working on a prediction rule for just these situations. That could then be your best performing prediction rule.
How good can a prediction rule be?
The ultimate prediction rule gives, in its applicable situations, certain predictions that are always correct. In other words, the probabilities it assigns are always 1 or 0 and the predictions always turn out to be correct. That can be achieved by careful choice of situations, including the outcomes, and by learning.
‘Night follows day (if you live in London)’ is such a prediction rule, expressed in ordinary language.
Many situations where probability is useful make it impossible to reach this ideal level of predictive performance. Outcomes may depend on so many different things, and so sensitively, that we can't possibly gather enough information, quickly and accurately enough, and crunch the numbers fast enough to make a useful prediction. The toss of a coin is the obvious example but many practical situations involve an element of uncertainty that cannot be eliminated entirely.
Judging prediction rules
How can we judge prediction rules, and so select the ones that work best, or develop better ones? Calibration is only one aspect of the performance of a prediction rule. The criteria that could be applied include:
The quality of the prediction (the higher the better)
Calibration (the more accurate the better)
Entropy (the lower the better). This is a formula from Information Theory that is useful in judging probability assignments because it says something about how informative some probabilities are. For example odds of 50:50 are less informative than 90:10. If there are some alternative outcomes and each is assigned a probability, then the total entropy is minus the sum of p.log2(p) for each outcome. There is an analogous formula for continuous probability distributions.
Breadth of application (the wider the better)
Ease of use (the easier the better)
The performance of a set of prediction rules might be judged by some kind of averaging.
Performance might vary over time. This might well be because hidden variables in situations that seem the same are systematically altering over time, making past experience a less reliable guide to the future.
The quality of predictions is a very deep subject with many unanswered questions. Some fascinating work has been done in connection with weather forecasting.
Calibration is one aspect of quality that is fairly well established. A well calibrated prediction rule produces probabilities that are close to or match the actual frequencies of outcomes found.
However, calibration alone is not enough. Predictions that give probabilities near to 1 or 0 are more informative than predictions that give probabilities near to 0.5. For example, half the patients given a new drug may have died, and giving a probability of death of 0.5 would be well calibrated. However, if all the men died and all the women survived it would be more informative to predict death for men and life for women, and equally well calibrated.
Shannon's Information Theory offers a formula for calculating amounts of information.
The best way of combining calibration and informativeness into a single measure of quality has yet to be established. Indeed, it isn't even clear that this is possible.
Judging learning strategies
Good learning strategies produce good prediction rules from limited experience with low computation and data gathering needs. The way the prediction rules improve over experience might be interesting to study.
What about random variables?
One of the philosophical arguments that never seems to get resolved is whether randomness exists at all. Are there things in nature that are really random and impossible in principle to predict with certainty, or do we live in a billiard ball world where one thing leads to another and our difficulty is simply that it is too hard to predict?
Ironically, the ideas of chaos theory, which you might think make the world seem more random, actually argue strongly for the deterministic view because it has now been shown that there are many situations where future behaviour is incredibly sensitive to initial conditions. We now know that a deterministic world could still look very random indeed!
Supporters of randomness argue that subatomic particles are examples of true, naturally occurring randomness. Their opponents point out that the randomness is part of the theories physicists currently prefer but that doesn't make it a reality.
For most practical purposes this question is irrelevant because we normally give up trying to find predictability long before we get near to any kind of genuine natural limit. Partly this is because prediction is costly and not always worth the effort of seeking improvements.
However, another reason we give up early is the language and philosophy of the mathematical techniques used. Mathematical models are the one place where you can be sure of finding random variables in abundance. Our models of the world contain randomness by assumption. Often the techniques amount to trying to fit a model to real world data and declaring the remaining discrepancies ‘random.’
Other phenomena that help us predict the future
Earlier I pointed out that stable relative frequencies make probabilities useful. There are other helpful characteristics of the way the world works that make it easier for us to predict the future.
One can be seen in the shape of many frequency distributions. For example, in this one notice how the relative frequency of adjacent values tend to be similar. In other words, the graph is smoothly varying. Not every distribution has this characteristic but think how hard it would be to understand the world if none had this property.
Another helpful phenomenon is the fairly consistent causal effect of some factors. For example, suppose we look at the life expectancy of different sets of people and in each set we know a lot of facts about each person. Regardless of which set of people we look at – male vs female, black vs white, short vs tall – people who smoke will tend to die earlier.
Suppose we have four groups: (1) male smokers, (2) male non-smokers, (3) female smokers, and (4) female non-smokers. Imagine we are uncertain about how long people in these sets will live. The life expectancy in each group is not independent. The groups with males will be brought down by the maleness, and the groups that smoke will be killed early by their habit, even though the other factors are present and may even interact.
This kind of connection can be exploited to learn more about relative frequency from a given set of cases.
Something that makes prediction more difficult
Something that makes prediction more difficult is when we are uncertain about whether a situation belongs to a particular set or not. It may be that details have yet to emerge, and this stops us from using certain prediction rules we would otherwise be eager to use.
We may have to resort to making probabilistic predictions about which sets of situations the situation will be a member of, and then combining those with the predictions from the prediction rules we would use if the situation was indeed a member of the relevant set.
For example, suppose someone has two coins, one with Head on both sides, and the other with Tails on both sides. Tomorrow they will toss one of the coins but today we have to give a probability of Heads. Ideally we would like to know which coin will be used so we can use the obvious prediction rules to say with certainty what the result will be. Unfortunately, we don't know which coin will be used so we have to assign probabilities to each being used and combine these with the probabilities that would apply given knowledge of which coin is used.
Final word
Probabilities are fascinating and useful. I hope this has at least helped your thinking.
Next time you catch yourself talking about ‘the probability’ of something take a moment to consider alternative prediction rules and applicable sets of situations. Remember there are usually plenty to choose from so there is no one probability. Some may be more appropriate to the decisions you need to make. Some may make better use of the empirical data available. Some may be easier to develop or apply. Look for better alternatives.
Made in England